Stack
Next.js
TypeScript
Tailwind
FastAPI
Python
pandas
scikit-learn
◆FRED / OWID
Featured case study
Dashboards and pipelines for oil-market signals—structure, risk, volatility, and model-driven views. Built for reproducibility with clear lineage from ingestion through the UI.
Live cross-fade from repo screenshots. Swap in assets/petroview-demo.gif when ready.
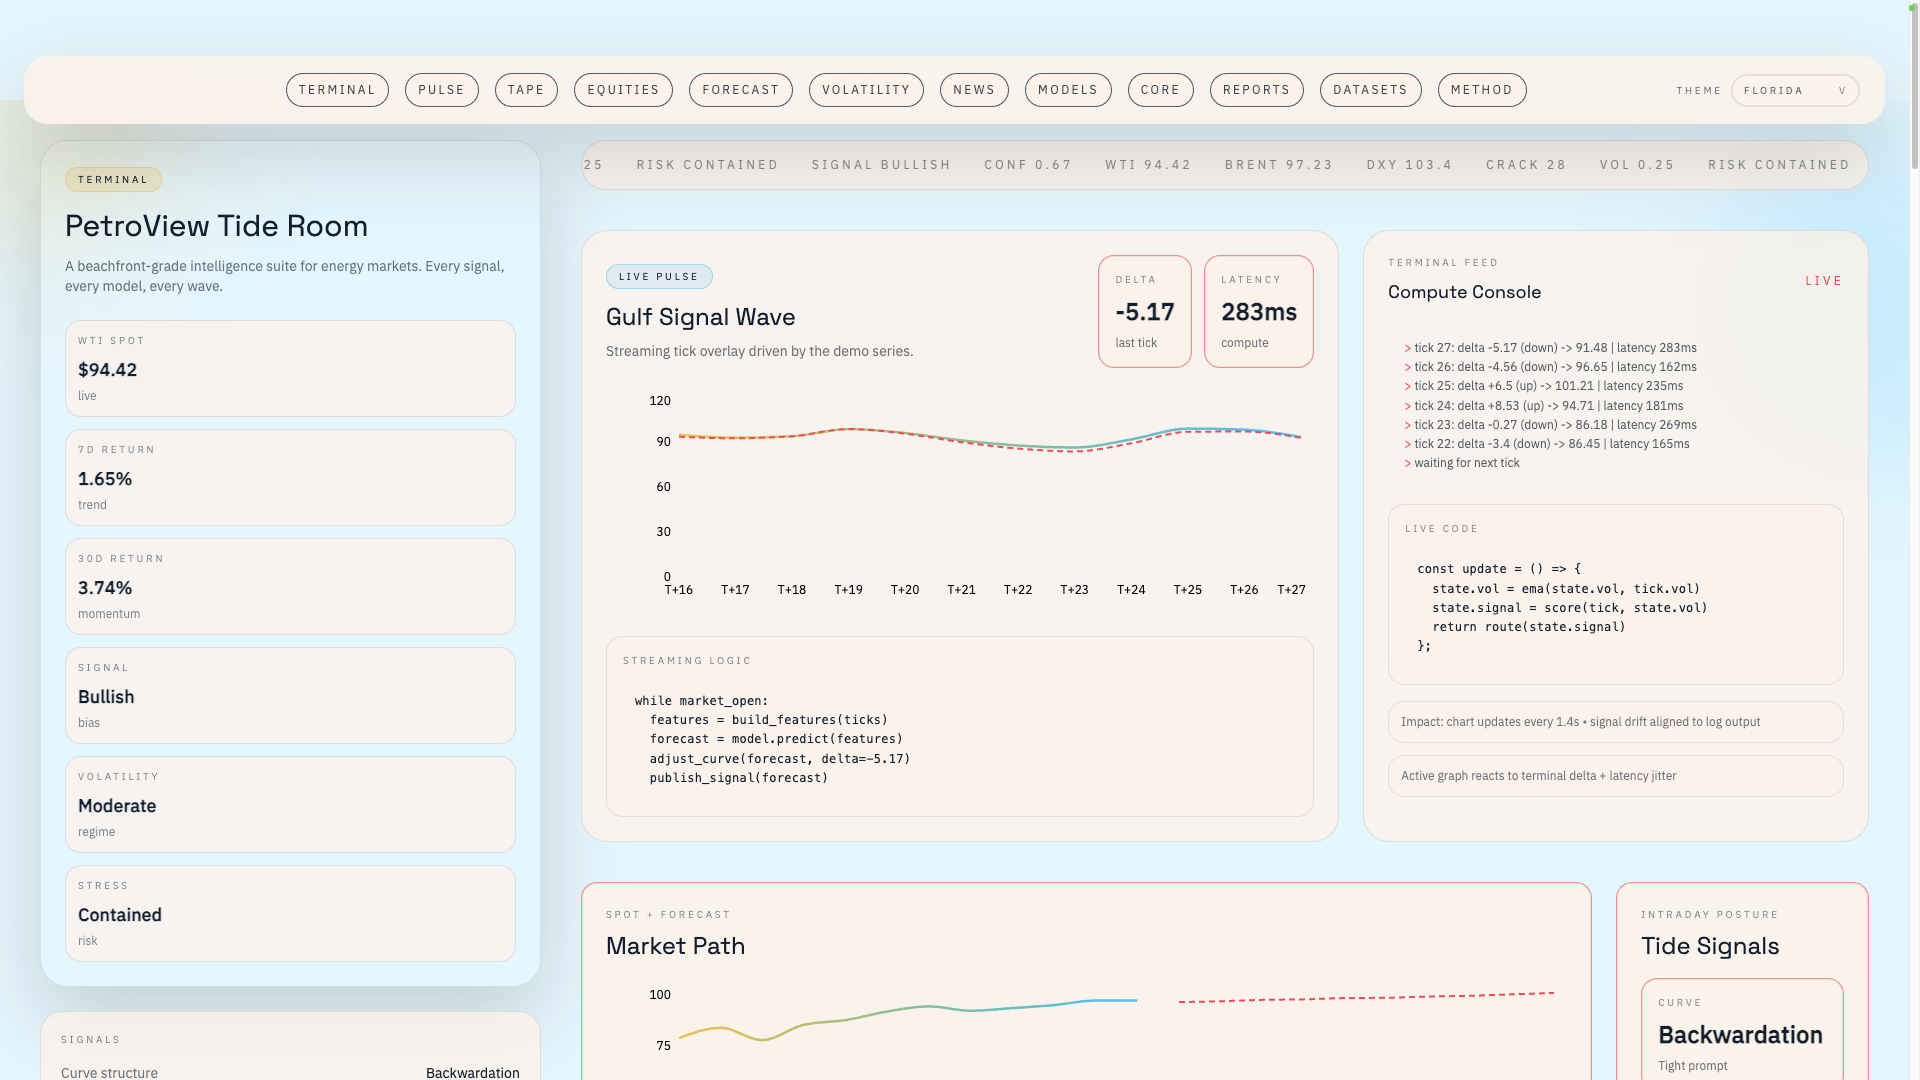
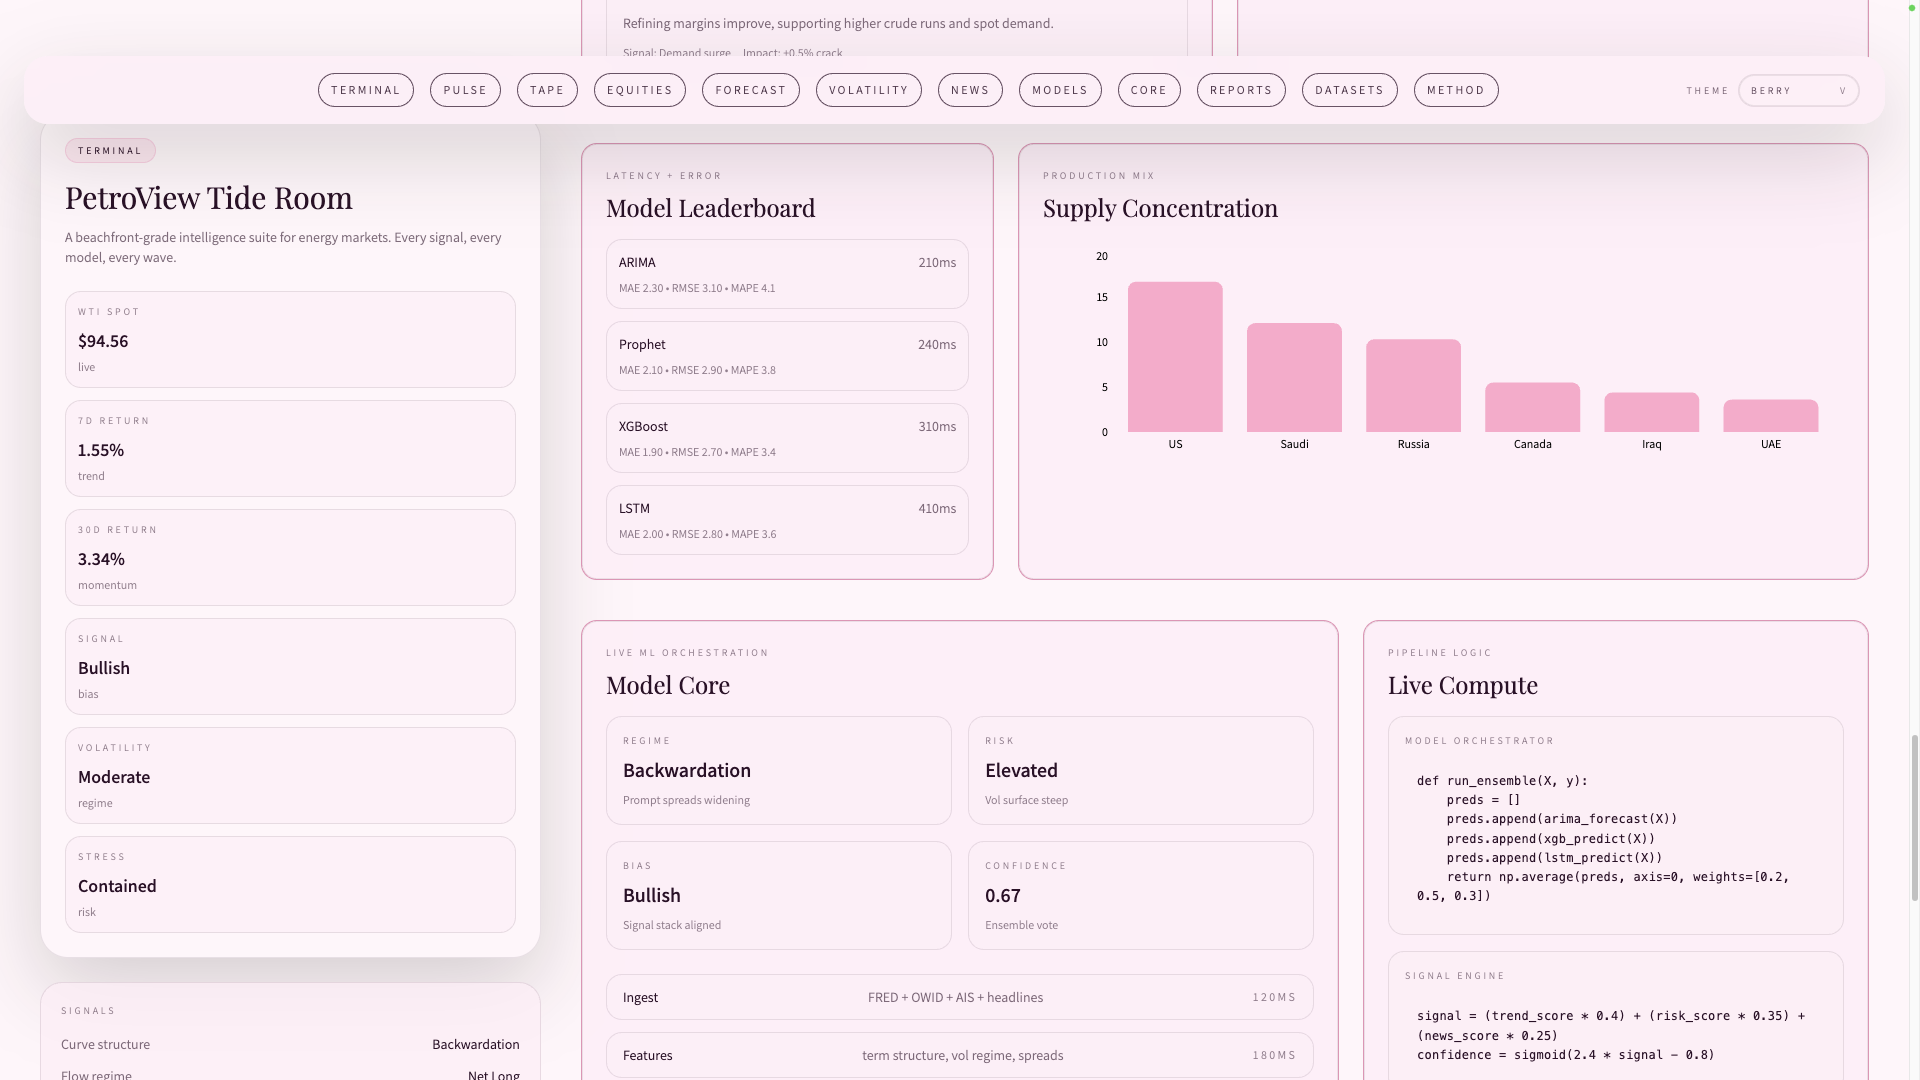
PetroView pulls global oil signals into one operational lens: volatility, regimes, and forecasts sit next to narrative context, so decisions aren’t split across spreadsheets. The stack is reproducible from ingest through the dashboard.
Frontend: Next.js (App Router), TypeScript, Tailwind, Recharts.
API & modeling: FastAPI, SQLModel, pandas, statsmodels, scikit-learn.
Data: FRED and OWID energy and macro series.